Features · Monitoring
Live logs and site monitoring.
Bothy is a native Mac app for local PHP development. As well as serving your sites, it watches them: requests and errors per site, response times, PHP-FPM status and live logs, so you find out a page is throwing 500s or getting slow before you go looking.
Why monitor a local environment at all
Local development usually has no observability: something is slow or broken, so you open a terminal, remember where the log file lives this week, and tail -f it. That works for one site. With a dozen sites, several PHP versions and a couple of database servers, the first question is often simply which thing is misbehaving.
Bothy already sits in the request path (Caddy serves every site, php-fpm runs every pool), so it has the data. It puts it on screen rather than leaving it in files.
The dashboard: the whole server at a glance
The dashboard shows which services are running, requests and 5xx errors per hour across all sites, and memory per service sampled every second. The header shows the domain, PHP and MySQL versions. If a service has stopped or a site has started returning errors, it's visible here before you've opened a browser.
- Live memory graphs per service
- Requests and 5xx per hour
- Stop All / Start All

Per-site stats and a traffic chart
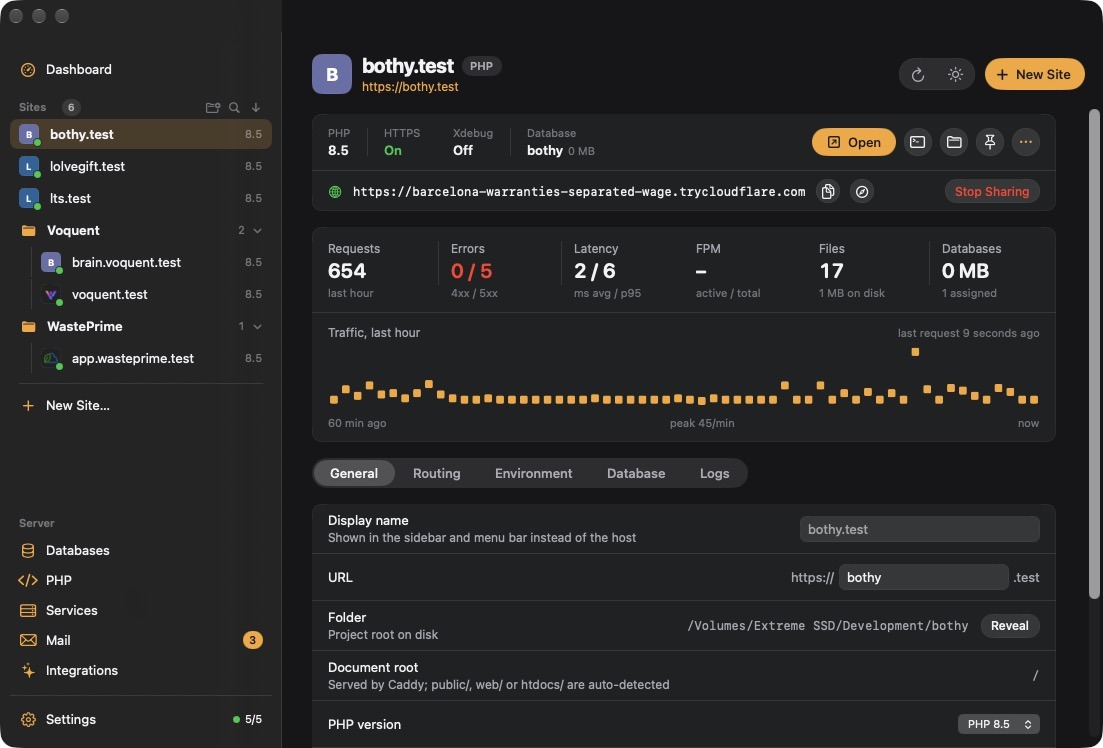
Each site's page shows its own requests per hour, 4xx and 5xx counts, p95 response time and FPM status, with a traffic chart for the last hour and tabs for routing, environment, database, git and logs.
- Per-site stats from Caddy access logs
- PHP-FPM status for the site's own pool
- Database size from information_schema
Where the numbers come from
- Requests, 4xx/5xx and p95 come from Caddy's JSON access log. Every request is a structured line with host, status and duration, so per-site counts and latency are calculated from real traffic rather than sampled.
- PHP stats come from each site's php-fpm status endpoint. That's only possible because every site has its own pool (see multiple PHP versions); with one shared pool, you couldn't tell which site was using the workers.
- Database sizes come from MySQL's
information_schema, for the databases assigned to the site.
Why p95 and not the average
An average response time hides the slow requests you actually care about: ninety fast cached pages and ten three-second ones average out to something that looks fine. The 95th percentile is the time that 95% of requests beat, so it moves when a real share of requests get slow: an N+1 query on a listing page, a missing index after an import, a plugin making a remote call on every load.
Live logs: access, PHP and slow
Each site's Logs tab follows its logs live, like tail -f, with a filter field and a pause button for when something scrolls past too fast. There are three kinds:
- access: every request Caddy served for the site, with status and timing.
- php: PHP errors, warnings and notices from the site's pool.
- slow: php-fpm's slow log, which records a stack trace for requests that run past a time limit. It shows where a slow request was spending its time, not just that it was slow.
Service logs (Caddy, dnsmasq, PHP, MySQL) are available in the app too, which is usually where to look when a service won't start.
The same from the terminal
For scripts, for agents, or for when you just live in a terminal:
bothy stats                 # CPU/memory per service
bothy stats shop            # req/h, 4xx/5xx, p95, FPM, db size
bothy stats shop --json     # for scripts and agents
bothy logs shop --kind php  # access | php | slow
bothy logs caddy            # any service log
Details in the stats and logs docs.
Doctor: a health report that changes nothing
bothy doctor checks the Homebrew prefix, whether Caddy and dnsmasq are installed, the /etc/resolver/test file, installed PHP and database versions, and which services are running. For anything missing it names the command that fixes it, but it never runs anything itself, so it's always safe to run. bothy doctor --json gives the same report in machine-readable form, and it's the first thing to include if you ask for support.
Letting an AI assistant read the logs
Monitoring data is most useful when whoever is fixing the bug can see it. Through Bothy's MCP server, assistants get bothy_site_stats, bothy_site_logs, bothy_stats and bothy_doctor, so you can ask "show me the last 5xx errors for shop" and the assistant reads the actual PHP log instead of guessing from the code. See Bothy's MCP server.
Questions
From Caddy's JSON access log. Requests per hour, 4xx/5xx counts and p95 response time are calculated per site from it.
A php-fpm feature that writes a stack trace for requests that run longer than a set time. Follow it with bothy logs shop --kind slow or in the site's Logs tab.
Yes. The Logs tab has a filter field and a pause button.
No. It's read-only: it reports what's missing and names the command that fixes it, but never changes anything itself.
Yes. bothy stats shop --json and bothy doctor --json, like every bothy command, support --json.